Cycling has long been a popular pastime in the U.S., but the combination of the COVID-19 pandemic and increased awareness of environmental issues gave cycling a large boost back in 2020. Over the past few years, bike sales and bicycle commuting have increased, leading many cities to introduce cyclist-friendly measures like bike lanes.
To learn more about America’s love for cycling, we explored cycling statistics from 2022. How many people are still enjoying this activity since its spike in popularity during the pandemic? In which cities is cycling most popular, and why are people riding? We’ll also answer frequently asked questions about cycling, bike safety, and bike laws.
U.S. Cycling Statistics
Although the popularity of cycling in the U.S. pales in comparison to that of the Netherlands, bike riding is enjoyed across the country by many people of all ages. Let’s look at general cycling statistics: How many Americans are cycling, what are the age demographics of bicyclists, and why do they choose to ride?
How many cyclists are in the United States?
Cycling has enjoyed fairly consistent popularity in the U.S. The number of cyclists hovered around 43 million from 2010 to 2015, then began a steady climb before spiking to almost 53 million in 2020. In 2021, the number of cyclists dropped slightly to 51.4 million, but cycling was still more popular than in the previous decade.

Who cycles the most?
Most of us remember the thrill of learning to ride a bike, which continues to captivate the littlest riders. Over half of children ages 3-9 rode a bike at least once in 2022. As children became young adults, bike riding became less popular, with only 47% of those aged 10-17 and 41% aged 18-24 having cycled. However, cycling didn’t really drop off until people hit 55 years old, with only 20% of those 55 or older having cycled last year.
Surprisingly, men were much more likely to have ridden a bike than women; 40% of men went cycling in 2022, compared to only 27% of women.

Where do people cycle the most?
Cycling is prevalent throughout the country, but it enjoys the greatest popularity in the American West. Of those who live there, 37% went bike riding at least once in 2022. Second to the West, 35% of those in the Midwest cycled in 2022, followed by 33% in the Northeast, and 31% in the South.
Interestingly, the amount of cycling varied little between community types. In 2022, 35% of people in small towns and urban areas cycled at least once. Meanwhile, 33% of suburban dwellers rode, while rural areas saw slightly less cycling at only 30%.

Northeast states include Connecticut, Maine, Massachusetts, New Hampshire, New Jersey, New York, Pennsylvania, Rhode Island, and Vermont.
Southern states include Alabama, Arkansas, Delaware, Florida, Georgia, Kentucky, Louisiana, Maryland, Mississippi, North Carolina, Oklahoma, South Carolina, Tennessee, Texas, Virginia, and West Virginia.
Midwest states include Illinois, Indiana, Iowa, Kansas, Michigan, Minnesota, Missouri, Nebraska, North Dakota, Ohio, South Dakota, and Wisconsin.
Western states include Alaska, Arizona, California, Colorado, Hawaii, Idaho, Montana, Nevada, New Mexico, Oregon, Utah, Washington, and Wyoming.
Why do people cycle?
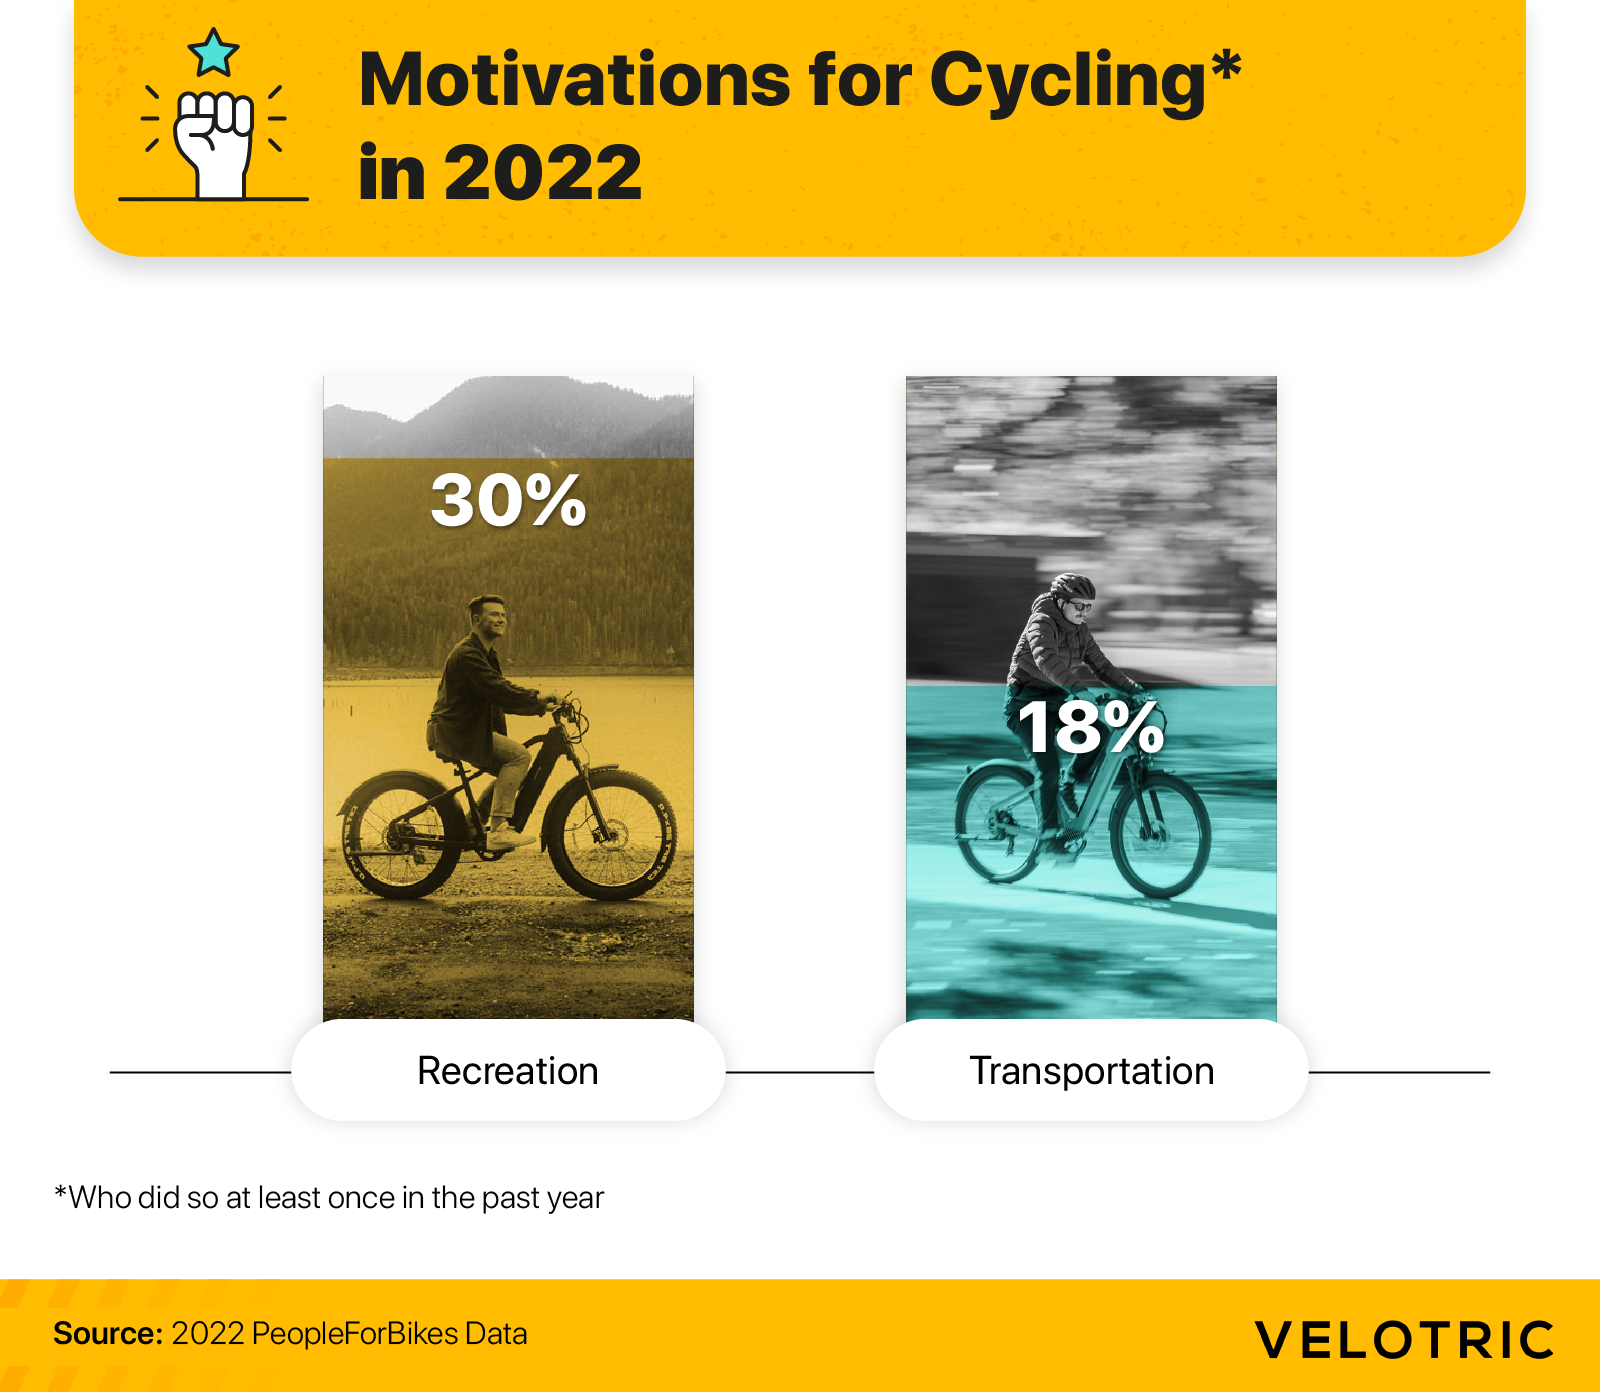
Cycling was all about fun in 2022. Recreation was the top reason why 30% of cyclists rode last year, compared to 18% who rode for transportation purposes. Cycling is also a low-impact activity that people of all ages can do in almost any environment and at a relatively low cost. And once you’re fully grown, a bike can last for years if you take good care of it.

Aside from being fun, cycling also offers many health benefits, including:
- Improved cardiovascular health
- Reduced blood pressure
- Improved lung health
- Weight management
- Reduced risk of Type 2 Diabetes
- Improved balance and coordination
- Improved mental health
Cycling can also help you sleep better and even improve your overall mental capability.
Bike riding is also excellent for the environment. Most notably, it reduces greenhouse gas emissions and the human impact on local plant and animal life. Transportation was the number one contributor to greenhouse gases in 2020, and commuting by bike instead of car or bus can lower an individual’s carbon dioxide emissions by as much as 84%. Many would-be bike commuters worry about inhaling CO2 emissions from motor vehicles while riding, but a Copenhagen study shows that cyclists are exposed to less air pollution than car commuters.
Cycling Statistics by State
As we continue to look at how the popularity of cycling has changed since 2020, let’s take a closer look at state-specific cycling statistics. Which states have the most cyclists, and which are the most bike-friendly?
How many people commute by bike in each state?
The following data from the American Community Survey by the U.S. Census Bureau shows the estimated number of bicycle commuters per state. Montana had the most bike commuters per 100,000 residents (580), followed by Oregon (487). The entire West (except Nevada) had a strong population of bicycle commuters, even Alaska and Hawaii. In contrast, the Midwest and South had very few bike commuters.

What are the most bike-friendly states?
Based on state scorecards from the League of American Bicyclists, Oregon ranked second on the Most Bike-Friendly States list. Only Massachusetts ranked higher, but the state earned a D in traffic laws and practices. Perhaps if they improved in that area, even more commuters there would opt for cycling.
On the low end of the list, Montana ranked No. 42, despite having been home to the most bicycle commuters. Joining Montana at the bottom of the list was Mississippi at No. 48, where the fewest bicycle commuters resided. Nebraska was No. 49, and Wyoming—the state with the fifth-highest rate of bike commuters—was last on the list.
Which states have safe passing laws?
States can improve bicycle safety by creating bike lanes and implementing safe passing laws, which require motorists to allow at least three feet of space when passing a cyclist moving in the same direction. Some even require drivers to change lanes before passing. These laws keep bicyclists at a safe distance from cars, trucks, and other large vehicles, reducing accidents, injuries, and fatalities.
Most states have safe passing laws, but a few have yet to pass them. The only states without safe passing laws are Alaska, Idaho, Iowa, Missouri, Montana, New Mexico, New York, North Carolina, South Carolina, Texas, and Vermont.

Cycling Safety Statistics
As cycling becomes increasingly popular, bicycle safety is of the utmost importance. Safe passing laws, designated bicycle lanes and bike paths, bicycle helmet laws, and public education have all been focal points in the cycling industry. How well have these safety measures been working? Let’s look at cycling safety statistics to find out.
How many people are injured by bikes each year?
As bicycle safety laws have increased, nonfatal bike injuries have decreased. In 2010, there was an average of almost 517,000 nonfatal bike-related emergency room (ER) visits per year. Injuries hit a low point in 2018 with just under 307,000. Nonfatal injuries have increased slightly since then, but so has the number of cyclists.

How many people die in bike accidents each year?
Unfortunately, like any activity, the worst can sometimes happen. While cycling fatalities occur, cycling is generally very safe, with a mere 0.002% chance of fatality. While the number of bicycle-related fatalities has increased over the past few years, this may be attributed to the increase in the number of cyclists. Despite some risk, cycling is still a very safe activity with benefits for both individual and public health.

Do helmets actually help prevent injury?
When it comes to bicycle safety, proper helmet use is the single most important precaution cyclists can take. Head trauma can lead to significant brain injury or death. Luckily, researchers found that bicycle helmets reduce serious head injury by 60%.

The importance of proper helmet use has led many states and cities to pass bicycle helmet laws, including new helmet laws for electric bikes. For example, New York State requires anyone 14 years of age or younger to wear a bicycle helmet, but helmet laws for e-bike riders vary by town. In New York City, all e-bike riders under 18 years of age, working cyclists (like couriers and delivery riders), and anyone riding a class 3 e-bike must wear a helmet.
While many recreational cyclists find bicycle helmets uncomfortable and sweaty, a properly fitted helmet can save your life.
E-bike Statistics
While road and mountain bikes have been around for decades, electric bikes are new to the bicycle market. There are three classes of e-bikes, often used to determine e-bike laws and safety requirements.
- Class 1: Motorized bicycle that only provides assistance when the rider pedals and has a maximum assisted speed of 20 mph.
- Class 2: Throttle-assisted motorized bicycle with a maximum assisted speed of 20 mph.
- Class 3: Motorized bicycle that only provides assistance when the rider pedals and has a maximum assisted speed of 28 mph.
All classes of e-bikes are booming in popularity. People use e-bikes for recreation, commuting, bike tours, city-wide bike-sharing programs, and more. With many types and models to choose from, e-bikes are quickly becoming a favorite mode of transportation across the country.
What are the most popular types of e-bikes?
Apart from the three classes, e-bikes come in several variations. The most popular type is the standard e-bike, which looks exactly like your average non-motorized bike. Mountain bikes are the second most popular e-bike, allowing riders to stray from the beaten path and explore rugged terrain. The third most popular types were a tie between step-thru bikes, with their easy-on, easy-off design, and cargo bikes. Cargo trailers are a versatile cargo bike alternative for those who want the best of both worlds.

How fast are e-bikes?
The various models and classes of e-bikes are each capable of different speeds. Both class 1 and class 2 e-bikes have a maximum motorized speed of 20 mph, which is how fast 55% of e-bike riders tend to cruise. For those wanting to compete in an e-bike road race, class 3 bikes can reach motorized speeds of up to 28 mph.

Why do people use e-bikes?
Just like standard bikes, electric bikes are great for various purposes. Almost half of all e-bike riders have primarily used them for recreation or exercise. Another 34% used e-bikes for commuting, and 29% used them for running personal errands.

Misconceptions about e-bikes lead some to avoid them for exercise, but electric bikes are great for physical health. First of all, e-bikes are only motor-assisted, not fully motor-powered, so they still require effort from the rider. Second, studies show that e-bike riders bike more often, farther distances, and for longer periods than standard bike riders—even when not riding their e-bike. While electric bikes may offer assistance on long hauls and steep hills, the joy of the cycling experience leads e-bike owners to be more physically active than standard bike riders.
Are e-bikes as safe as standard bikes?
As with standard bikes, e-bikes are safe if you take proper safety measures. All cyclists should know and comply with state and local bicycle laws, always wear a properly fitted helmet, and ride carefully and cautiously, especially around motor vehicles. The U.S. Department of Transportation’s National Highway Traffic Safety Administration has excellent guidelines on bicycle safety that every cyclist should know.

Start Riding With Velotric Bike
Cycling is a popular and beloved pastime across the country. Cyclists enjoy riding for fun, exercise, commuting, travel, and more. And as more Americans embrace the health and environmental benefits of bike riding, states and cities are working to make their communities more bike-friendly. As the U.S. becomes more navigable for cyclists, the introduction of e-bikes to the bicycle market is making long-distance biking more accessible, too. If you’re ready to embrace the cycling life and ditch the four-wheeled commute in favor of the open air, start riding today with Velotric Bike.
Methodology
Multiple sources were used to collect data for this project. The number of cyclists in the United States was found through Statista. Demographics, locations, and reasons for cycling in 2022 were gathered from a PeopleForBikes study. We used data from the Census Bureau’s American Community Survey to find the number of commuter cyclists. State scorecards from the League of American Bicyclists were used to find the most bike-friendly states and those that have safe passing laws. To find the number of injuries and fatalities, we used the Centers for Disease Control and Prevention’s Web-based Injury Statistics Query and Reporting System and the Department of Transportation’s Fatality Analysis Reporting System. Finally, the e-bike statistics are from a 2018 report released by the National Institute for Transportation and Communities.
Fair Use Statement
Are you a cycling enthusiast? Feel free to share this article with anyone you’d like. We just ask that you do so for noncommercial purposes only and provide a link back to this page to give the authors their due credit.


